

Why a new condo launch nearby could be the best time to sell your home — and 2 other signs to watch

Here are the best signs to look out for when you're trying to sell your home.
PHOTO: Stackedhomes
The tricky part about timing the market is that it’s never one right decision.
More often than not, it’s a series of decisions you need to make, such as what to buy, how much to allocate in terms of a budget, and of course when to list your property on the market.
Finding the right time to put up your property for sale tends to be one of the most stressful decisions in this process.
While purchasing a property is a big decision, selling one involves a lot more emotional baggage that can often cloud your judgement.
For instance, some owners may feel attached to a home they have lived in for years, while others can become fixated on a neighbour’s record sale price.
Perhaps the biggest bugbear faced by sellers is how much private home prices have risen since the end of the Covid-19 pandemic.
For many existing homeowners, the cost of a replacement property may be too high for them to bear right now, especially if you don’t feel confident in getting a good price for your home.
So, how can sellers better understand the nuances in the market, and the best circumstances, under which you might hope to sell your property?
Writer’s Note: By “major new launch” we’re referring to non-boutique private residential projects. In our view, boutique projects, which feature a relatively small handful of units and a small land area, may not have the same market impact as a more conventional new project launch.
This may sound a bit counterintuitive but the arrival of a new launch project in a neighbourhood stirs up competition in the housing market there. Generally, new developments tend to be priced higher than the surrounding resale projects.
As buyers compare the price of the units at the new development against nearby alternatives, there’s a chance that your resale unit starts to look like better value.
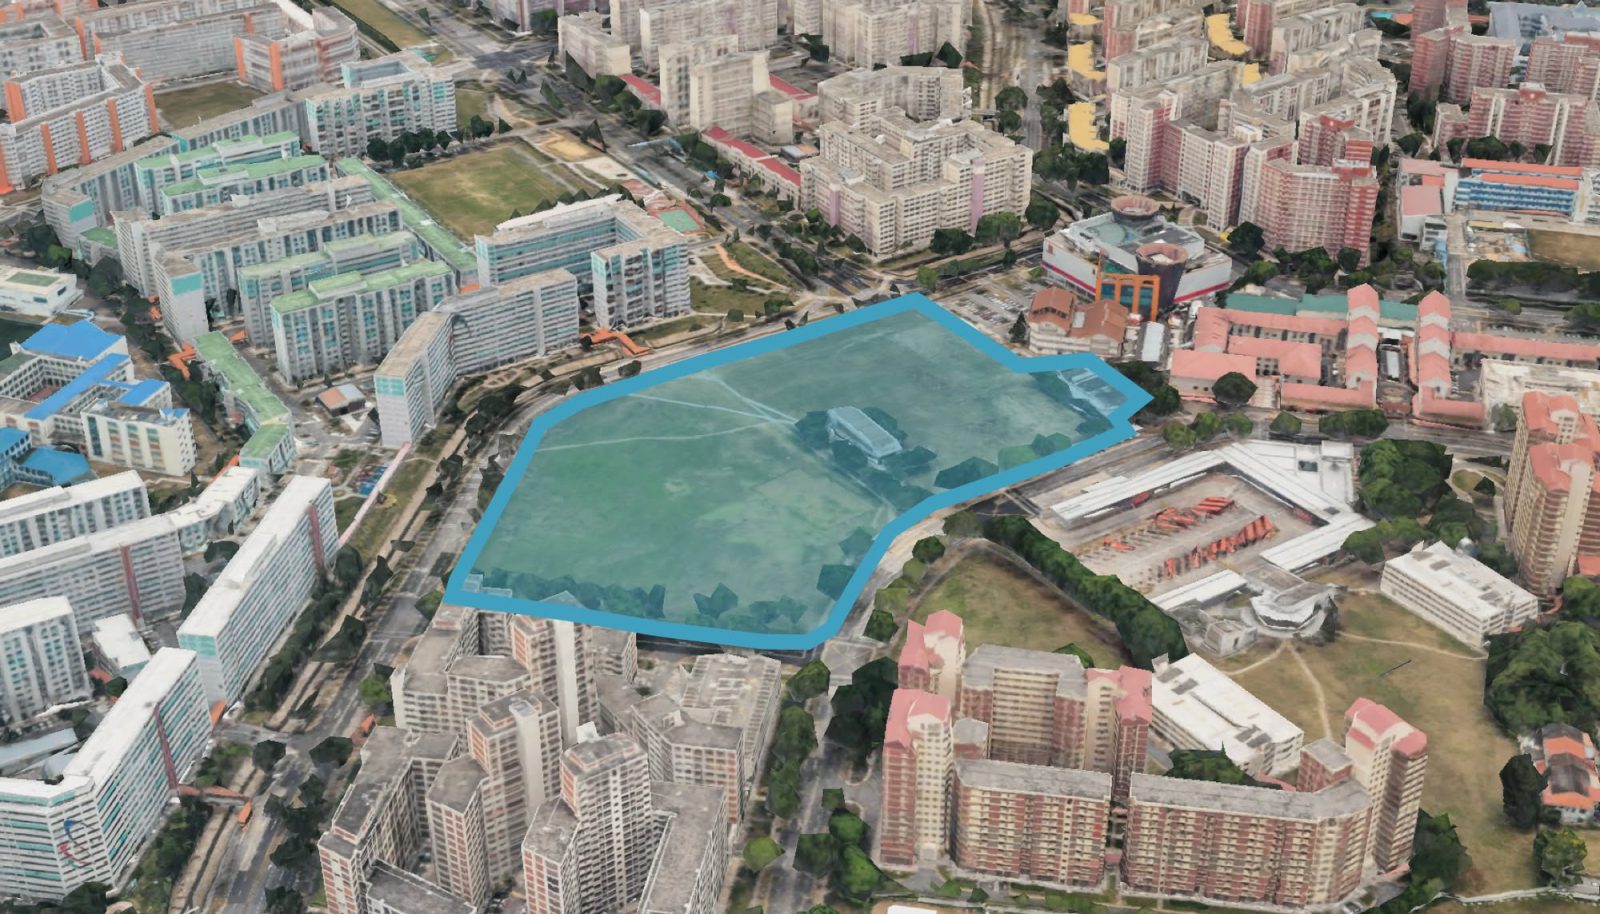
We referenced this recently in our article on the upcoming integrated development at Hougang Central.
As Hailey mentioned in the article, buyers who find themselves priced out of that future launch could instead turn their attention to more affordable nearby projects.
In the case of the upcoming Hougang Central integrated development, there’s a chance that nearby condos like Riverfront Residences and The Florence Residences could look more attractive due to their lower resale price compared to the new integrated project.
Thus, there’s always an opportunity for sellers in the area to capitalise on the arrival of a new project in their area that establishes a new price benchmark for the neighbourhood, which can have a knock-on effect on the perception of nearby resale values.
Our Stacked Pro writer, Joey, studied the impact of some large new developments that attained their Temporary Occupation Permit (TOP) or completion in 2021 and 2022.
By tracking the average $PSF of the new project and neighbouring resale projects between 2015 and 2025, it enables us to observe the overall price movements before the arrival of the new launch project, during its construction, and in the years after its completion.
| Year | DAINTREE RESIDENCE | HIGH OAK CONDOMINIUM | HIGHGATE | NOTTINGHILL SUITES | SIGNATURE PARK | TERRENE AT BUKIT TIMAH | THE BEVERLY |
| 2015 | $849 | $928 | $1,346 | $1,010 | $1,381 | $1,179 | |
| 2016 | $829 | $960 | $1,477 | $1,053 | $1,350 | $997 | |
| 2017 | $857 | $959 | $1,538 | $1,080 | $1,256 | $1,116 | |
| 2018 | $1,702 | $914 | $1,132 | $1,579 | $1,195 | $1,265 | $1,202 |
| 2019 | $1,652 | $982 | $1,207 | $1,610 | $1,276 | $1,397 | $1,180 |
| 2020 | $1,687 | $1,029 | $1,164 | $1,485 | $1,324 | $1,498 | $1,110 |
| 2021 | $1,699 | $1,071 | $1,313 | $1,444 | $1,388 | $1,613 | $1,114 |
| 2022 | $1,881 | $1,165 | $1,403 | $1,646 | $1,570 | $1,721 | $1,075 |
| 2023 | $2,035 | $1,276 | $1,423 | $1,665 | $1,575 | $1,822 | $1,010 |
| 2024 | $2,076 | $1,371 | $1,526 | $1,601 | $1,670 | $1,829 | $1,201 |
| 2025 | $2,040 | $1,397 | $1,559 | $1,856 | $1,722 | $1,966 | $1,789 |
| per cent increase from 2015 to 2018* | 7.65 per cent | 21.95 per cent | 17.34 per cent | 18.27 per cent | -8.35 per cent | 2.02per cent | |
| per cent increase from 2018 to 2022** | 10.50 per cent | 27.53 per cent | 23.96 per cent | 4.20 per cent | 31.35 per cent | 36.03 per cent | -10.59 per cent |
| per cent increase from 2022 to 2025*** | 8.48 per cent | 19.89 per cent | 11.12 per cent | 12.77 per cent | 9.73 per cent | 14.19 per cent | 66.37 per cent |
* From 2015 to Daintree Residences’ launch
** From Daintree Residences’ launch to TOP
*** From Daintree Residences’ TOP to 2025
| Year | JADESCAPE | BOONVIEW | MARYMOUNT VIEW | SEASONS VIEW | TRESALVEO |
| 2015 | $952 | $1,205 | |||
| 2016 | $1,170 | $1,012 | $977 | $1,368 | |
| 2017 | $1,145 | $1,142 | $989 | $1,445 | |
| 2018 | $1,669 | $1,325 | $1,097 | ||
| 2019 | $1,693 | $1,304 | $1,329 | $1,081 | $1,510 |
| 2020 | $1,740 | $1,355 | $1,314 | $1,080 | $1,454 |
| 2021 | $1,778 | $1,468 | $1,445 | $1,138 | $1,520 |
| 2022 | $1,915 | $1,636 | $1,481 | $1,173 | $1,701 |
| 2023 | $2,130 | $1,610 | $1,522 | $1,301 | $1,802 |
| 2024 | $2,172 | $1,648 | $1,707 | $1,434 | $1,912 |
| 2025 | $2,286 | $1,721 | $1,668 | $1,394 | $2,038 |
| per cent increase from 2015 to 2018/2019* | – | 11.41 per cent | – | 15.19 per cent | 25.31 per cent |
| per cent increase from 2018/2019 to 2022** | 14.71 per cent | 25.51 per cent | 11.77 per cent | 6.92p er cent | 12.65 per cent |
| per cent increase from 2022 to 2025*** | 19.40 per cent | 5.20 per cent | 12.63 per cent | 18.87 per cent | 19.78 per cent |
* From 2015 to Jadescape’s launch
** From Jadescape’s launch to TOP
*** From Jadescape’s TOP to 2025
| Year | STIRLING RESIDENCES | ALEXIS | COMMONWEALTH TOWERS | QUEENS | QUEENS PEAK | THE ANCHORAGE |
| 2015 | $1,706 | $1,256 | $1,224 | |||
| 2016 | $1,574 | $1,246 | $1,186 | |||
| 2017 | $1,620 | $1,172 | $1,858 | $1,223 | ||
| 2018 | $1,760 | $1,632 | $1,917 | $1,227 | $1,407 | |
| 2019 | $1,838 | $1,532 | $1,852 | $1,269 | $1,509 | |
| 2020 | $1,970 | $1,441 | $1,836 | $1,240 | $1,878 | $1,462 |
| 2021 | $2,042 | $1,493 | $1,895 | $1,334 | $1,866 | $1,471 |
| 2022 | $2,156 | $1,621 | $1,970 | $1,432 | $2,004 | $1,685 |
| 2023 | $2,284 | $1,681 | $2,091 | $1,563 | $2,126 | $1,767 |
| 2024 | $2,322 | $1,779 | $2,200 | $1,703 | $2,198 | $1,889 |
| 2025 | $2,381 | $1,752 | $2,225 | $1,818 | $2,217 | $2,010 |
| per cent increase from 2015 to 2018* | -4.36 per cent | – | -2.35 per cent | – | 14.90 per cent | |
| per cent increase from 2018 to 2022** | 22.50 per cent | -0.68 per cent | 2.79 per cent | 16.72 per cent | – | 19.79 per cent |
| per cent increase from 2022 to 2025*** | 10.42 per cent | 8.09 per cent | 12.94 per cent | 26.95 per cent | 10.62 per cent | 19.25 per cent |
* From 2015 to Stirling Residences’ launch
** From Stirling Residences’ launch to TOP
*** From Stirling Residences’ TOP to 2025
| Year | THE TAPESTRY | ARC AT TAMPINES | Q BAY RESIDENCES | THE ALPS RESIDENCES | THE SANTORINI | THE TROPICA | WATERVIEW |
| 2015 | $743 | $803 | $978 | ||||
| 2016 | $1,142 | $782 | $945 | ||||
| 2017 | $856 | $1,130 | $1,041 | $796 | $965 | ||
| 2018 | $1,384 | $921 | $1,118 | $1,212 | $853 | $999 | |
| 2019 | $1,336 | $934 | $1,110 | $1,239 | $1,135 | $867 | $1,037 |
| 2020 | $1,376 | $907 | $1,100 | $1,243 | $1,151 | $863 | $1,017 |
| 2021 | $1,490 | $947 | $1,151 | $1,273 | $1,171 | $911 | $1,042 |
| 2022 | $1,578 | $1,097 | $1,239 | $1,344 | $1,253 | $1,024 | $1,130 |
| 2023 | $1,646 | $1,227 | $1,366 | $1,414 | $1,373 | $1,137 | $1,271 |
| 2024 | $1,680 | $1,338 | $1,424 | $1,488 | $1,397 | $1,246 | $1,431 |
| 2025 | $1,702 | $1,380 | $1,490 | $1,520 | $1,466 | $1,315 | $1,480 |
| per cent increase from 2015 to 2018* | – | 24.00 per cent | – | – | – | 6.13 per cent | 2.16 per cent |
| per cent increase from 2018/2019 to 2021** | 7.64 per cent | 2.82 per cent | 2.94 per cent | 2.77 per cent | -3.42 per cent | 6.89 per cent | 4.32 per cent |
| per cent increase from 2021 to 2025*** | 14.24 per cent | 45.70 per cent | 29.46 per cent | 19.45 per cent | 25.26 per cent | 44.25 per cent | 42.02 per cent |
* From 2015 to The Tapestry’s launch
** From The Tapestry’s launch to TOP
*** From The Tapestry’s TOP to 2025
According to the data we’ve compiled, it suggests that Daintree Residences — a 99-year leasehold condo in District 21 – offers the clearest example of this trend.
After its 2018 sales launch to its TOP in 2022, nearby projects such as High Oak Condominium, Highgate, Signature Park, and Terrene at Bukit Timah all saw average resale price increases of 27.5 per cent, 24 per cent, 31.4 per cent, and 36 per cent, respectively.
Likewise for Stirling Residences — a 99-year leasehold development in District 3 — we see that condos like Queens and The Anchorage recorded an average resale price increase of 16.7 per cent and 19.8 per cent, during the period between the sales launch of Stirling Residences and its TOP.
This is a noteworthy example because Queens and The Anchorage had initially garnered a modest resale performance before the arrival of Stirling Residences in the neighbourhood.
Between 2015 and 2018, resale prices at Queens actually declined slightly, while The Anchorage recorded a more modest resale price increase of 14.9per cent.
This example suggests that the stronger resale price appreciation that took place while Stirling Residences was being built stemmed from the renewed buying interest in Queenstown after the project launched for sale.
In another example, the price performance at The Tapestry, an 861-unit condo in district 18, is another interesting example because it indicates that this price uplifting effect is not always immediate.
So far, we’ve seen that most neighbouring projects recorded modest price growth during the construction of a new nearby condo.
But in the case of this part of Tampines, several developments like Arc at Tampines, The Tropica, and Waterview went on to record gains of 45.7 per cent, 44.3 per cent, and 42 per cent, respectively after the completion of The Tapestry in 2021.
For sellers, the challenge is that timing this trend isn’t consistent.
The price of your resale unit may increase during or after the construction of the nearby new development. So, while a new project usually raises the benchmark prices in a neighbourhood, it’s hard to spot the precise selling window.
Often, working with an agent with a history of closing deals in that area, or who watches the nearby listings closely, has a better sense of how quickly resale prices tend to move.
A common mistake that some sellers make is assuming that buying demand for your resale unit will remain consistent throughout the year.
However, we’ve shown in several of our past articles that property prices tend to be influenced by the depth and purchasing power of the pool of active buyers.
When the number of buyers starts to decrease, so does price growth which usually plateaus. We’ve encountered this issue in several reader case studies and Q&As. In this analysis of a couple deciding whether to remain in their older Holland Close flat, or move to a condo, one of the concerns was the changing buyer profile.
While the flat still enjoyed a desirable location, Hailey noted that buyers would increasingly compare it against newer alternatives in surrounding areas. Over time, this could reduce the number of buyers willing to pay a premium for an ageing property.

In that article, the data indicates that from 2015 to 2025, the price gap between the older Holland Close blocks (completed in 1973/74) and the newer blocks (completed in 1997/98) widened from around $104,000 to almost $390,000.
Over the same period, the newer blocks appreciated by 49.2 per cent, whilst the older blocks gained just 9.3 per cent.
This suggests that — past a certain point in years — factors such as location might fail to overcome the age disadvantage.
As factors like lease balance and state of maintenance became more important, buyers became increasingly willing to pay more for newer homes.
This doesn’t mean demand for older properties disappears altogether, or that buyers are unwilling to pay for older housing.
Instead, it means they’re willing to pay substantially more for newer housing — so the price gap between older and newer developments, even in the same location — can widen much faster than expected.
Ideally, you’d want to sell before the situation reaches this tipping point.
There was also the issue of financing and eligibility.
With only around 47 years of lease remaining, the likely buyer pool was increasingly concentrated among older purchasers, as younger buyers would face restrictions on CPF usage and loan eligibility.
This meant the pool of potential buyers was gradually becoming smaller and more selective.
This doesn’t mean you need to rush and sell your home once its 20 or 30 years old, but it means that you need to temper expectations.
Waiting longer doesn’t just mean plateaued or limited gains, and it can affect its marketability which makes the unit harder to sell.
I’m not just referring to condo attributes such as the biggest pool or the most spacious units. I’m referring to current pricing comparisons.
A good example is this analysis of Summerdale. One of the project’s biggest strengths is that it offers large three-bedroom units at a quantum that’s among the lowest in the Lakeside area.
In 2025, three-bedroom units at Summerdale were transacting at an average of around $1.39 million, compared to $1.58 million for a similar unit type at Lake Life executive condo.
Likewise, three-bedroom units at The Lakeshore were going for an average price of $1.74 million, and at other projects like Lakefront Residences and The Centris the average price of a three-bedder was close to $1.9 million.
This makes Summerdale one of the few alternatives for buyers who want a full-sized family home near Lakeside MRT, without crossing the $1.5 million to $2 million budget.
That scarcity helps owners selling their units at Summerdale, and it has allowed this older project to maintain a resilient degree of price resilience.
However, the challenge is that much of Summerdale’s appeal stems from this value proposition.
While the project offers larger-sized units compared to its neighbours, it doesn’t have newer facilities or more efficient layouts. Its strongest selling point is that it remains one of the few options for large family homes at sub-$1.5 million.

But this advantage is not permanent. As neighbouring projects age, their owners become more willing to sell.
Likewise, new launches can become a double-edged sword for much older projects: while it does raise the benchmark (see point one), having an age disparity that’s too wide (e.g., 20+ years) can make your resale unit less appealing.
At that point, most buyers will want to see a much wider price gap between your unit and the newest option.
So, sometimes it’s best to sell while your property still occupies a competitive edge among the condos in its cluster.
A good property agent should know the latest transactions and deals done in their area of expertise. And in one case I know of (no names for anonymity), a seller was very nearly affected by a higher floor transaction.
The seller had been considering an offer for their unit, but was uncertain as it was among the first few offers.
But as it so happened, their agent heard another realtor selling a unit a few floors above them: this higher-floor unit had received its valuation, and it was lower than the offer for their lower-floor unit.
If a 10th floor unit gets valued at $1.7 million, then most buyers would hesitate at a fifth floor unit selling at $1.8 million.
Thus, the agent had to prompt his sellers to act and take an existing offer, before the higher floor unit transacted for less.
In short, the timing of nearby listings matters.
For example, an Executive Condominium (EC) that has just reached its MOP tends to see a lot of listings, as does a mega-development just outside the Sellers Stamp Duty (SSD) period. It can pay to get ahead of the rush before other listings start competing and setting the price ceiling for you.
This is one area of the property market where simply having data doesn’t replace an agent.
Sometimes, a professional with an ear to the ground (i.e., an agent who transacted in your area recently) has the better grasp of whether it’s a good time to sell.
[[nid:738315]]
This article was first published in Stackedhomes.